

Guides
Sourcing and inventory choices that hold up under demand
A useful answer to 'bakery inventory guide' starts with the work the team must deliver reliably, not with a borrowed benchmark. The point is not to copy a national.
What to take away
- One ingredient master record per item carries the specification, approved suppliers, allergen status, pack size, storage condition, shelf life, lead time, lot rule, unit conversion and substitute rule.
- Purchasing runs from the weekly batch planformula quantities minus usable stock, plus safety stock, checked against minimum orders and delivery days.
- Receiving needs a written door check, and every opened container needs a dated first-expire-first-out label.
- Yield variance by production stage and waste split by preventable cause show where to act.
- Substitutions get written approval before use, covering allergens, label claims, performance and cost.
- Set a par level, a reorder point and a safety stock for each high-value or long-lead item, test them against eight weeks of usage, and rebuild them after a menu change or a rejected delivery.
The rest of this article follows the work: master data, buying, receiving, rotation, yield, waste, supplier review. Numbers below are illustrative arithmetic, not published benchmarks. Ask your suppliers and your accountant for your own figures.
Start with the ingredient master
The ingredient master is the list every other process reads. When a formula, a purchase order and a label disagree about which flour is approved, nothing downstream holds together.
Write each record so a new hire can act on it during a rush. Include the supplier item number, because the buyer and the receiver must match the same physical bag.
[figure 3]
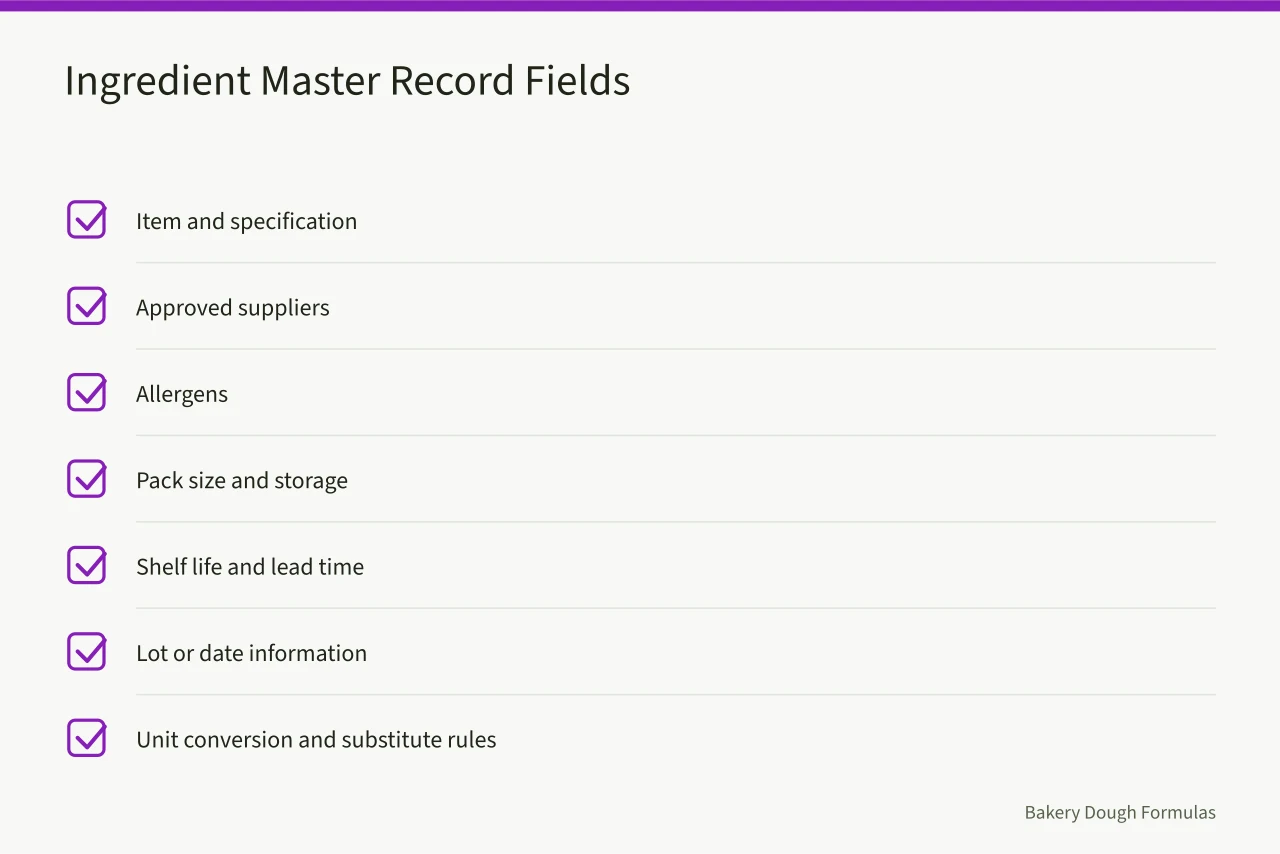
State the unit conversion and the rounding rule. A formula written in grams against a 50 lb bag invites scaling errors until someone writes the conversion down.
Allergen status belongs in the master, not in a folder. FDA guidance on food allergens separates packaged retail food from food wrapped in response to a customer's order, and that distinction belongs on each item line at FDA allergen questions and answers.
Many shops run this in Excel or Google Sheets first, then move to bakery finance and software tools once weekly counts stop matching the file.
Connect purchasing to production demand
Demand drives the order, not an empty shelf. Multiply the weekly batch plan by formula quantities for gross ingredient need, then subtract only the stock that is usable within its shelf life.
Add safety stock for items where a stockout stops a production day. Check minimum order quantities and delivery days before committing.
A weekly physical count beats a perpetual inventory number in most small shops. An unverified number is a guess.
Set par levels, reorder points and safety stock
A fixed order quantity runs short one week and heavy the next. A par level is the most stock you want when the next delivery lands. A reorder point triggers a new order. Safety stock covers a heavy week or a late truck.
All three come from your own usage. Weekly usage divided by days open gives a daily rate. Reorder point equals (daily usage x lead time in days) + safety stock. Par is the reorder point plus one order cycle of use.
Order quantity is par minus stock on hand minus stock on order. Refresh the usage history weekly so drift shows up before an empty shelf does.
Example: reorder point and yield variance
A shop uses 60 lb of bread flour a day, with a four-day supplier lead time and two days of safety stock.
The reorder point is (60 x 4) + (60 x 2) = 360 lb. Order when count plus incoming deliveries reaches 360 lb. If the Monday count is 300 lb and the next delivery slot is Thursday, the shop is already short.
Par sits at 600 lb, the reorder point plus four more days of use. At 360 lb, order 600 minus stock on hand and stock in transit.
Butter runs on a different clock. At 12 kg a week the daily rate is 2 kg. A two-day lead time and a 4 kg buffer put the reorder point at 8 kg and the par at 12 kg.
The same shop scales a batch for 110 loaves and sells 104. That is a 5.5 percent yield variance.
Find the cause before changing anything: divider scaling, trim at the moulder, or a count nobody recorded. Then split waste by cause instead of tracking one total:
| Waste type | Preventable | What it points to |
|---|---|---|
| Overproduction at the counter | Yes | Demand plan set too high |
| Dividing and trim loss | Yes | Scaling or divider setting |
| Display loss | Yes | A bake-off schedule that starts too early |
| Expired stock | Yes | Order size or rotation |
| Customer returns | Sometimes | Quality or packaging |
| Donation and staff use | No, but log it | Recovery, not loss |
EPA's Wasted Food Scale puts prevention above donation and upcycling, while noting that its environmental ranking does not replace safety or cost analysis.
Margin pressure from that split belongs in pricing decisions that protect margin, not only in the waste log.
Adjust order quantities when demand swings
Pull eight weeks of usage for each key item, divide by the baking days to get a daily rate, and compare the average week with the heaviest week. The gap is your demand swing. Multiply the swing by lead time in weeks, add a day of cover, then subtract stock on hand and stock on order from the par.
| Signal | What to read | Action |
|---|---|---|
| Usage rising three weeks running | Daily rate against the eight-week average | Raise the par by the swing and hold the buffer |
| Lead time slipping | Actual days from order to delivery | Add the extra days to the reorder point |
| New wholesale account | Weekly commitment in units | Rebuild the par from the new daily rate |
Receive, rotate and control substitutions
[figure 1]
Receiving Checkpoints
- Supplier
- Product
- Quantity
- Condition
- Temperature where relevant
- Date or lot
- Allergen and label
Receiving runs against the purchase order. Write down what the door check found, and record every rejection with a reason and a credit note number.
Check temperature on chilled items, the lot or best-by date, damage, and any change to the label or allergen statement.
Date every opened bag with the open date and the discard date. Purchase date is not shelf life, and the gap between them is where expired stock hides.
Approve substitutions in writing before use. A swap can change the allergen statement, the nutrition panel or the pack, so somebody has to sign off. For Canadian sales, CFIA enforces bilingual labelling and ingredient declarations, so a US-only swap may not carry over.
Review suppliers on evidence, not on price alone
Score suppliers on fill rate, lead time variance, document completeness, credits and recall history. A low invoice price with repeated short ships costs more than it saves.
Ingredient costs move with commodity markets. The BLS Producer Price Index publishes series for flour, dairy and fats, useful for a contract conversation and useless as a substitute for your own cost data.
A four-week rollout with targets
- Week 1build master records for the ten items that cause the most production stoppages. Target: an approved supplier, a unit conversion and a named backup for each.
- Week 2run the receiving check on every delivery, and brief the receiving team on what to reject. Target: 95 percent of deliveries with a completed record, matching the roles set out in our bakery hiring and training plan.
- Week 3start first-expire-first-out labelling and a daily waste log split by cause. Target: every opened container carries a date.
- Week 4calculate yield variance for the three highest-volume products. Target: an explained cause for at least 90 percent of the shortfall.